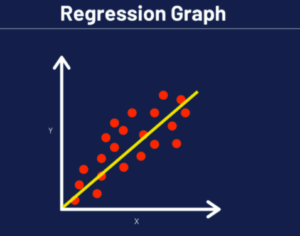
Regression?
Is basically, the opposite of correlation, Regression means: trying to calculate the relationship between one variable and the corresponding value of another variable.
In simple words, where one variable value affects another variable value. when the values are dependent on one or more variables then it called cause & effect, it is also understood that the result or the outcomes are dependent on one or more variable.
Since correlation is defined as relationship between 2 variables, whereas regression is defined as how they affect each other. E.g.: how heavy rainfall causes to grow different types of crops.
Predicting the stock of the company based on the data history as per the previous 2 years growth of company.
We might not go into much details of each type, in this article but the list below are the types of regression.
- Liner Regression.
- Logistic Regression.
- Ridge Regression.
- Lasso Regression.
- Polynomial Regression.
- Bayesian Liner Regression.
When to use regression?
It is also important to know when to use regression:
- When we are able to predict & optimise data. Eg , sales of the company revenue.
- When we are able to show the direction of the relationship between variables.
- When we are able to see cause and effect.
- When we can use regression in mathematical equation “y=a+b(x)”.
Also, important to know when not to consider correlation: Regression does not help us to interchange x & y value.
Regression Analysis:
The purpose of regression analysis is to help us understand the practical relationship between 2 variables ( x & y ), so that the experimental is able to estimate & identifying the unknown variables that can be used to make future prediction and goals.
The overall analysis is to estimate the value of unknown variable say (z) with known fixed values (x & y). The best fitting type of regression is Liner regression.
Regression analysis helps you give more information about your data then (correlation). With the help of equation that can used to predict and optimize the data & analyse the risk.

Regression formal
A -> refers to the Y- intercept, the value of y when x=0, B->refers to the slope or the rise over. y= a+b(x)
Why is correlation important in regression?
Since you have read all about correlation and regression, we can now conclude on why correlation is important in regression.
It is because having regression helps us understand which variable can affect the other variable (cause & affect), and correlation helps in understanding the strong relationship between 2 variables
Final verdict
Though they have practiced together, there are some similarities and difference between correlation & regression. When you want an equation, predict a response, use regression. When you want to brief the data, direction and strength of relationship use correlation.


